Professional Excel Dashboards – built in seconds
Create impressive analyses and business cases directly in Excel, no additional software needed. Insert, customize, done. Your templates, your style.
Key Features
For Efficiency and Clarity
Transform Excel into a powerful reporting tool with professional visualizations, automated workflows and consistent design standards – without adding unnecessary complexity.
Standardized Data Visualization
Create consistent visual standards across teams and reports – from KPI dashboards to executive presentations.
Learn MoreAutomate Reporting
Update reports instantly when data changes and eliminate repetitive formatting steps in weekly, monthly or quarterly reporting cycles.
Learn MoreProfessional Chart Templates
Save time with modular templates for monthly reporting, forecasting and management reviews.
Learn MoreSeamless Excel Integration
Works directly within Excel. No external tools, no data migration, no disruption of existing processes.
Learn MoreInteractive Dashboards
Create dynamic dashboards with slicers, filter, and charts - all directly within Excel, no coding no Power Query needed.
Learn MoreTailored for Professionals to create Sophisticated Data Visualization and Analysis
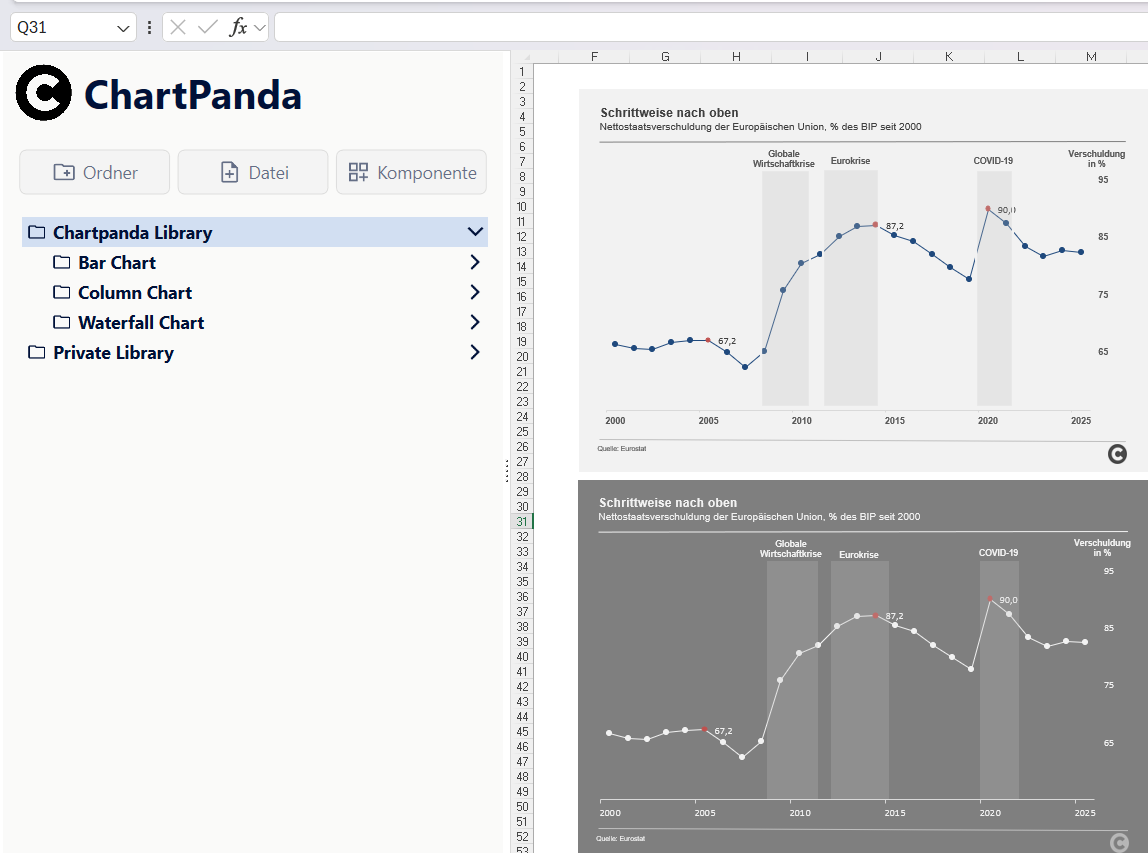
See What's possible
From cost center reports to executive dashboards – our add-in helps you create clear, meaningful charts in seconds. Below are some real-world examples to show how your data can come to life with Chartlayers.
First steps:
In Excel
Open Add-In
Launch the Add-In directly within Excel and access all visualization templates from one structured interface.
In sheet
Insert chart
Select your data and insert a fully formatted, professional chart into your worksheet in seconds.
For reporting
Ready to use
Adjust layout, colors and KPIs with a few clicks and turn raw data into reporting visuals.
Boost your productivity. Start using "Chartlayers" today.
Try the add-in for free and see how it can improve your reporting workflow.
Real Use Cases, Real Results
Visualize faster